Remote Debugger
When you're developing web apps using the browser on your computer, you're probably used to using the debugger to inspect the elements on the page, view console output, monitor network requests, etc. Thanks to the Chrome Developer Tools, it's possible to use the same debugger interface when your app is running on the Senza platform with the browser in the cloud.
Connecting
First of all, make sure that you're using the Chrome browser on your computer, as you won't be able to access the remote debugger from Safari or Firefox.
Device Simulator
To access the debugger when using the Device Simulator, simply click the Debug button when the simulator is connected and displaying your app. It will then open in a new tab. You'll see your web app's user interface being streamed to both the simulator and the debugger, but the performance will be better with Senza.
Cloud Connector
You can launch the remote debugger for a physical cloud connector device from the Senza Console. The home page shows your favorite and recently used devices, so if you see your device there you can click on the Debug button.
If you don't see your device there, click the See All link, or click Devices in the sidebar. Make a note of your cloud connector's device ID, which is written on the packaging and on the bottom of the device. You can either search by the device's ID, or select a tenant from the dropdown menu and browse through the list to find it.
Click on your device to open it. To make it easier to find next time, you can edit the description to something meaningful (i.e. "Eliza's device"), and add the device to your favorites so that it appears on the home page.
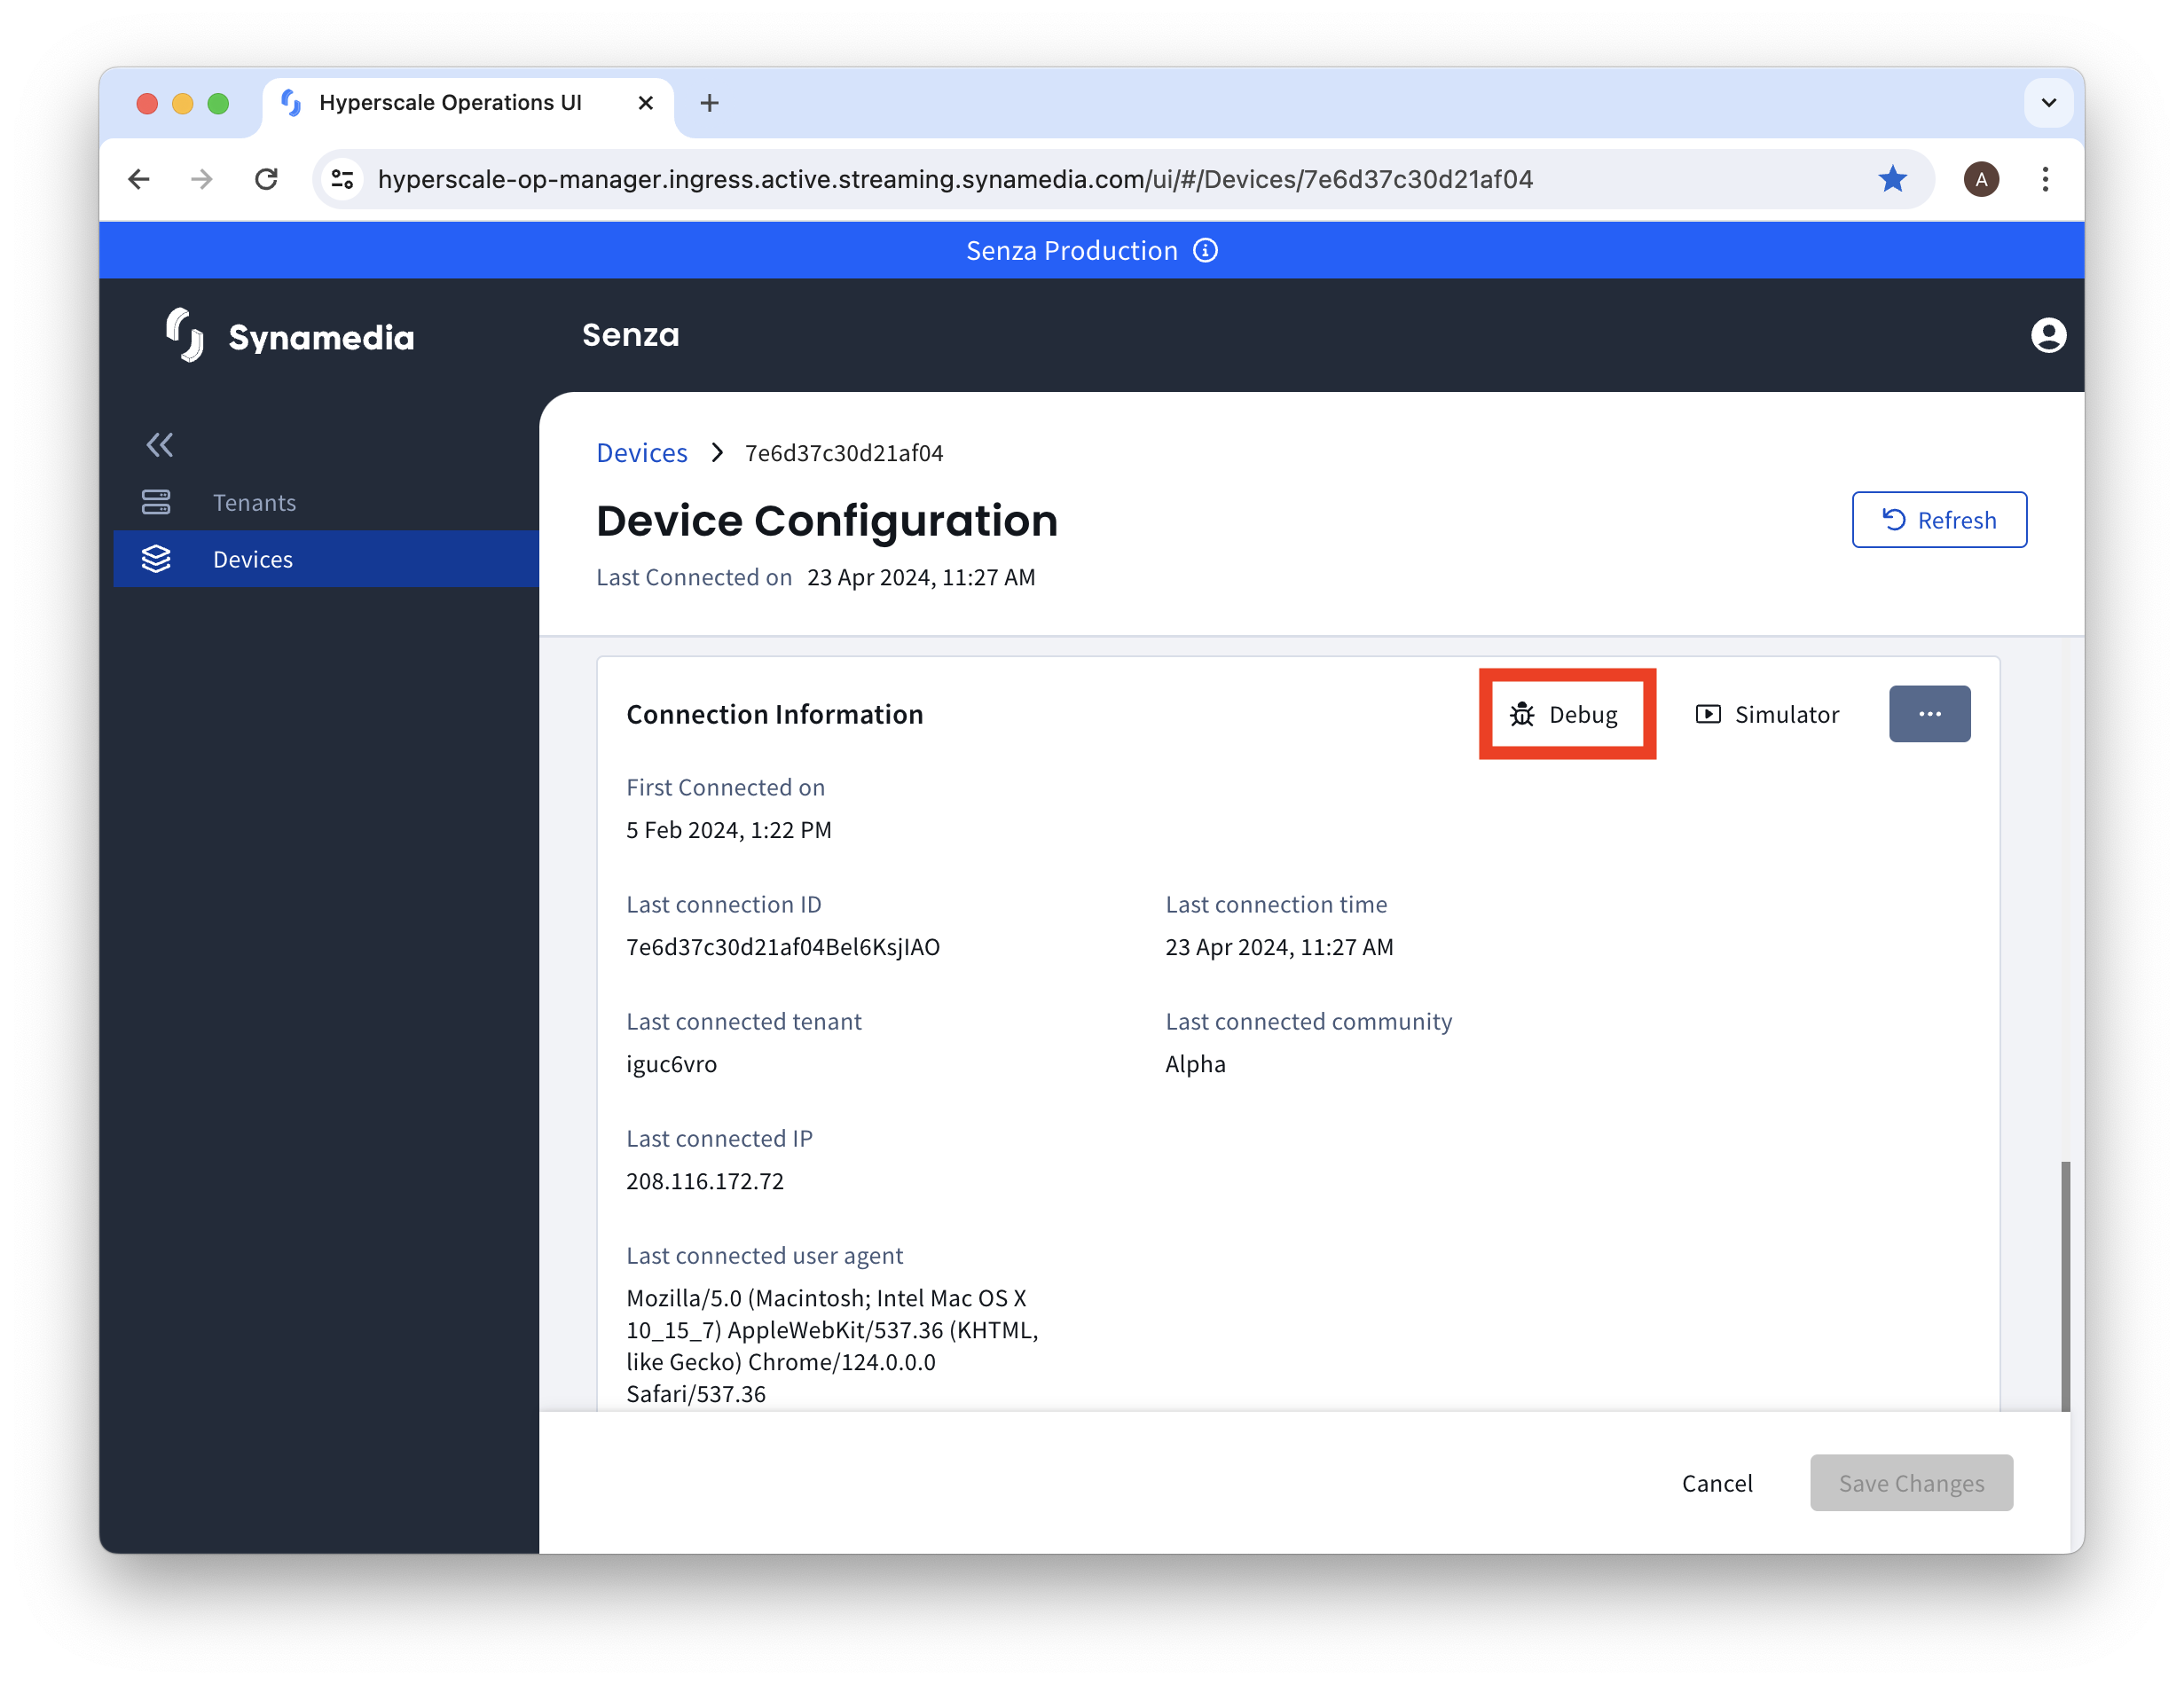
You can launch the remote debugger from the device details page by scrolling down to the Connection Information section and clicking the Debug button.

Note: You can only launch the debugger for a device that is currently connected and using the web browser, rather than streaming video. Otherwise the button will be disabled.
When you initially launch the debugger, you'll see a mostly empty page with a list of tabs, which will normally have just one link with the title of your web application. Click on the link to launch the debugger.
Interface

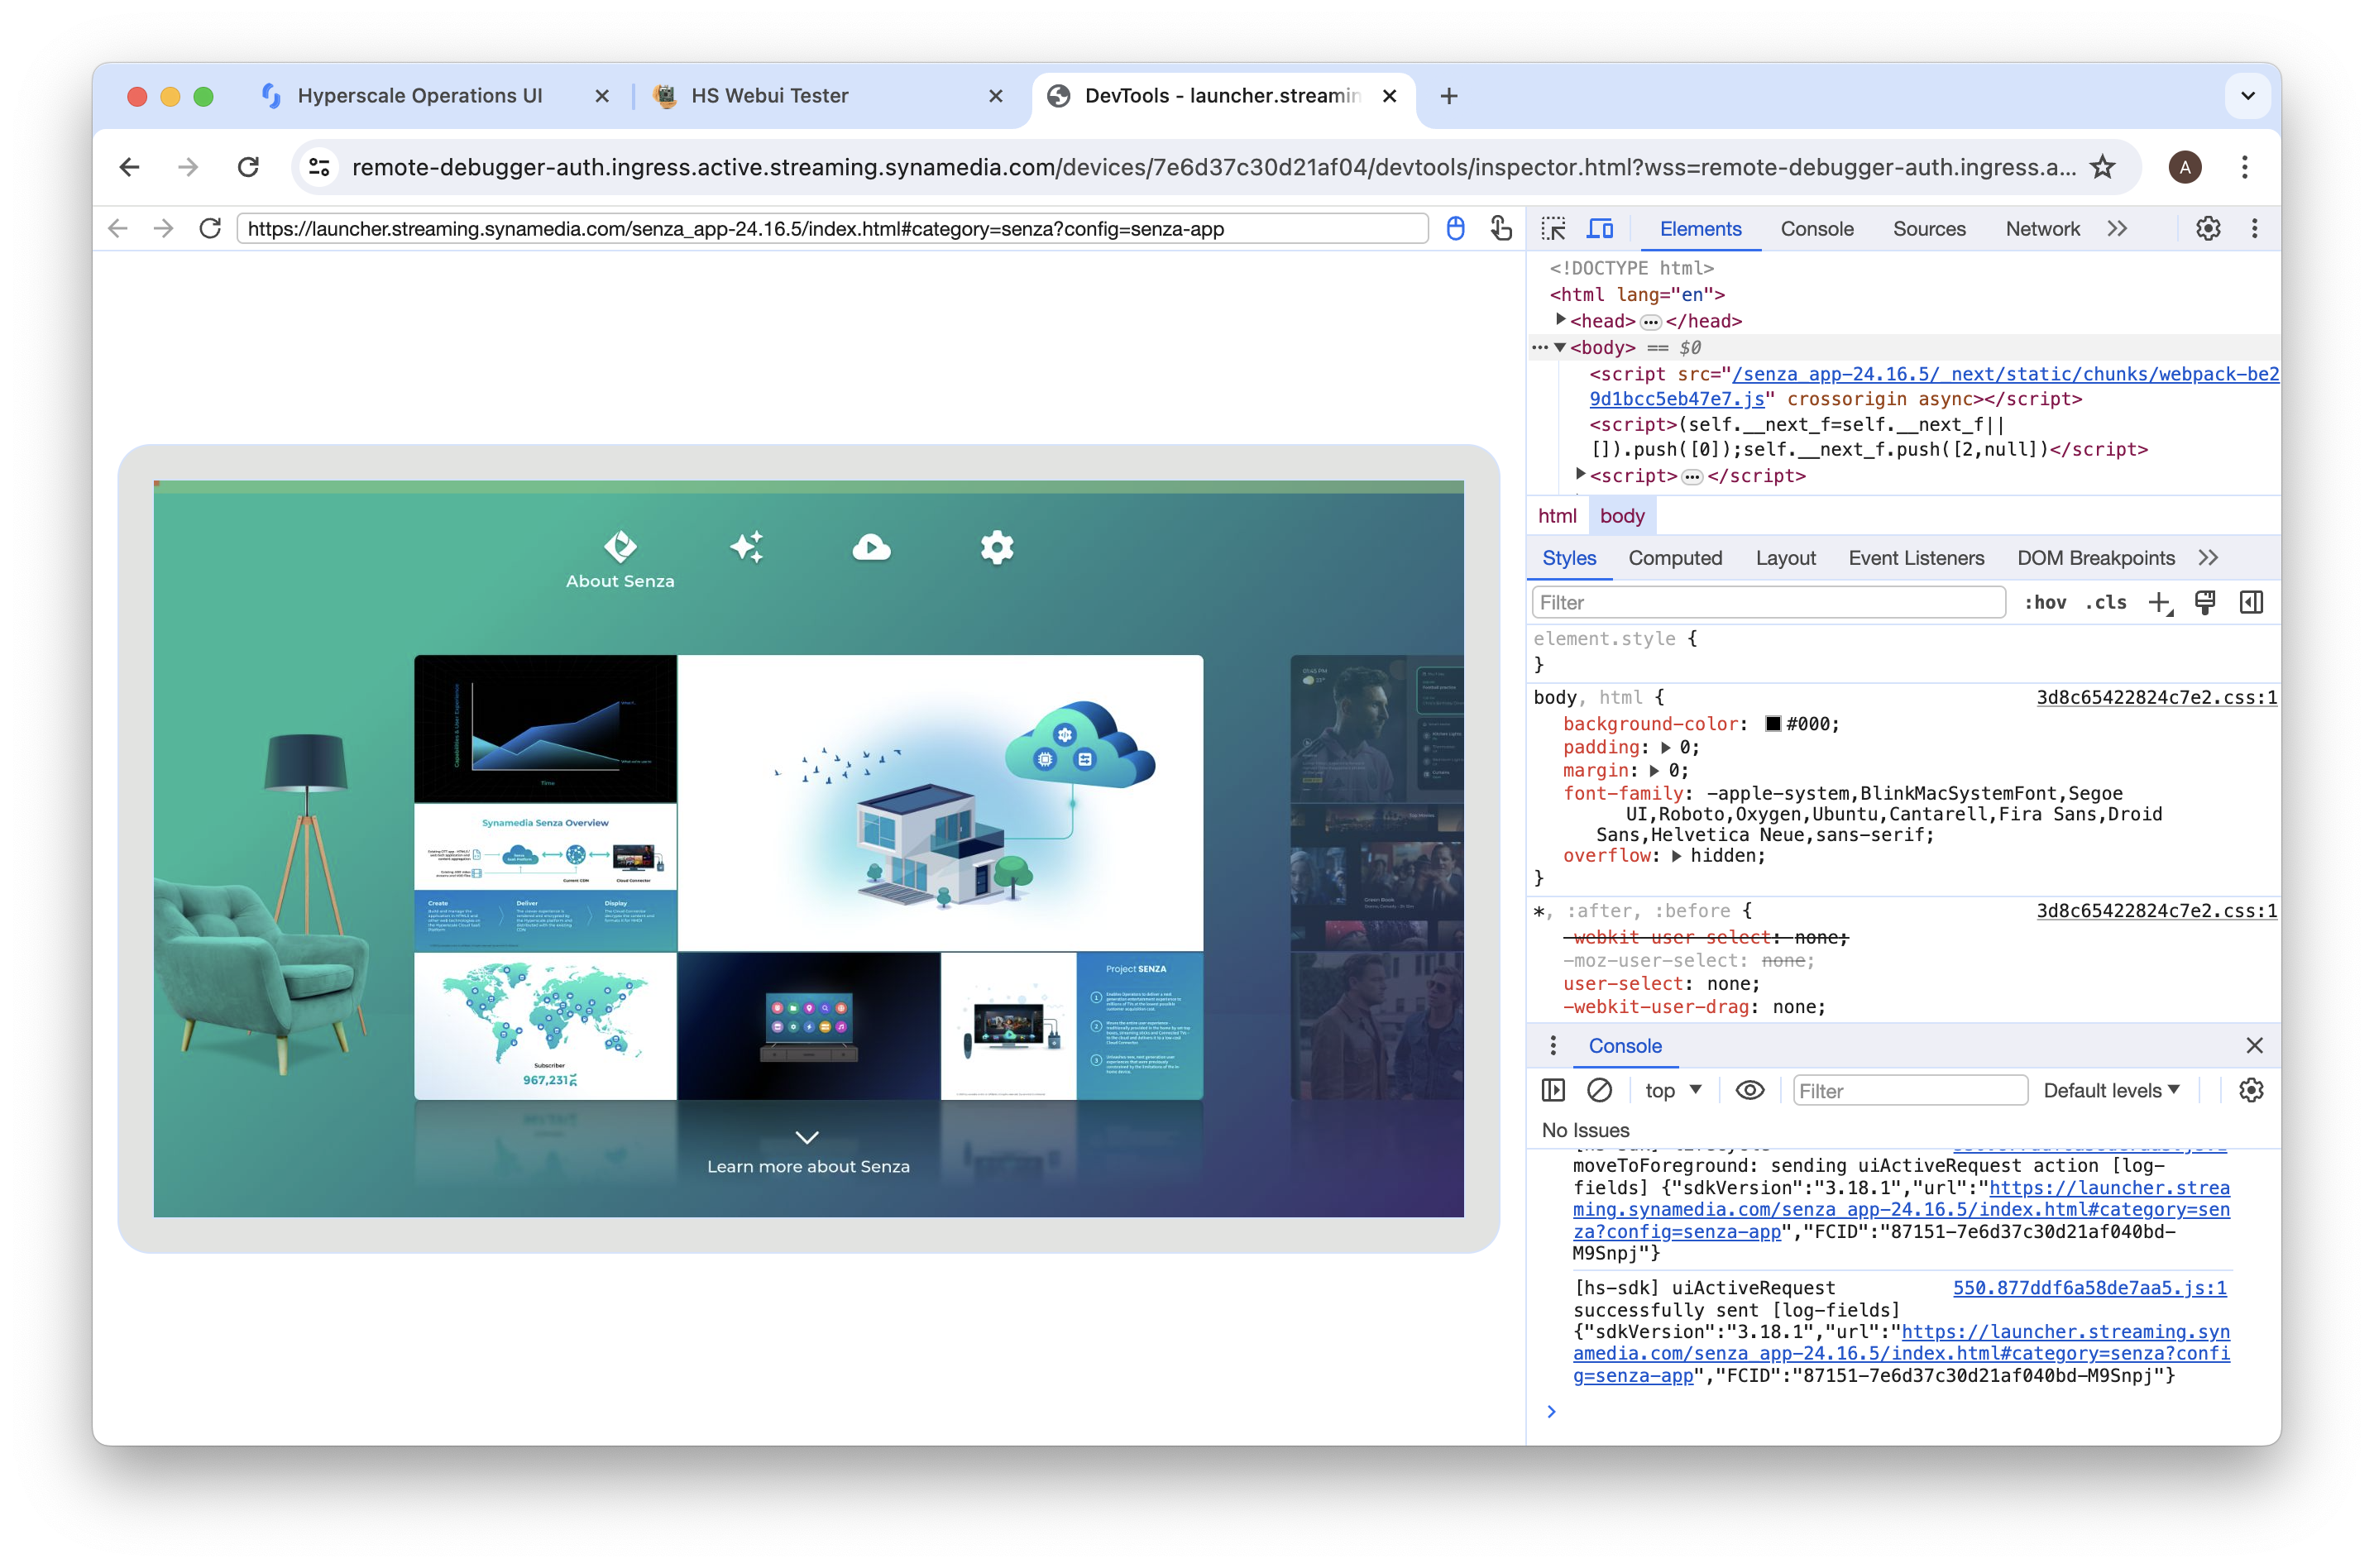
The remote debugger looks pretty similar to the normal Chrome debugger, with a few key differences. You'll see a preview of your app, although it's not as fancy as Senza, the frame rate will be rather low, especially with video.
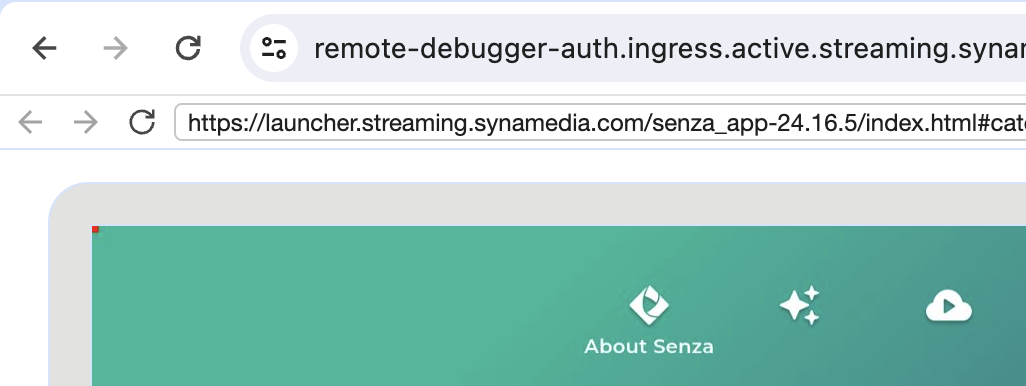
If you look carefully you'll also notice a toolbar with back, forward, and reload buttons as well as an address bar. It's right under the equivalent toolbar for your own browser, so make sure that you use the correct toolbar!

Changing the URL
The address bar is particularly useful, as you cannot only see the URL of the current page but you can also change the URL to navigate to a different page. When you do this you'll see the web page change instantly on your TV, because you are literally remote controlling the browser that is streaming video to the TV.
This is particularly useful during development if you want to test a website on one device without changing the configuration used by other devices. For more information, see Setting the URL.
Note that changing the URL in this way only affects the current state of the browser, and is not saved in the configuration. See Overriding Device URLs for some options for setting the URL for individual devices so that you don't have to launch the debugger every time you just want to change the URL.
Navigation
You can use the same keyboard equivalents for remote control navigation that you would use in the Simulator. Make sure to first click on the video preview so that it has focus.
If you need to use mouse and keyboard input during development, you can use the debugger as a workaround. This may be necessary to enter login credentials before you've updated your app to use Device Authentication.
Features
Just like in the regular debugger, you can access features in the tab bar such as:
- Elements: view and manipulate elements in the DOM
- Console: view console logs and run JavaScript commands directly
- Sources: view the page HTML source
- Network: inspect and profile network requests
- Performance: profile the execution of your app
- Memory: see how much memory your app is using
- Application: view the contents of cookies and local storage
In the console output you'll see both messages from your app as well as messages from the Senza platform.
Limitations
The Remote Debugger has a few limitations:
- Audio is not supported.
- Playing video in the browser has a lower frame rate than in the simulator or on a physical device.
- If you switch to playing streaming video, the browser will go into background mode and the preview will stop updating. It is only connected to the browser and cannot switch to displaying the video that is being streamed directly to the physical device.
- It will disconnect after a few minutes of inactivity between the app and the debugger. You can try clicking the "Reconnect" button if the browser is still running, otherwise you can repeat the steps above to connect.
Video Tutorial
Updated over 1 year ago